A Contemporary Positional Multi Modal Assessment Approach to Training Monitoring in Elite Professional Soccer-Juniper Publishers
Juniper Publishers
Understanding positional differences in terms of specific movement, speed and mechanical demands imposed upon elite professional soccer players in training and match play is of paramount importance to further develop player performance. The primary investigation aim was to examine a novel multi-metric method and reveal the representation of a tapered structure referencing a direct relationship with competitive match demands. The study involved 29-elite male European soccer players (26.7±4.07 years, height 183.4±5.87cm, body mass 78.4±8.03kg, VO2max 57.55±5.32mL.kg−1.min−1 and sum of 8 skinfolds 54.12±13.65mm). Daily positional TL data relating to competitive match day (MD) data was assessed via a Global Positioning System (GPS) across a 22-week period during the mid-phase of the competitive season. Results revealed differences between playing positions; central forwards (CF) revealing lower average intensity values when compared with CBs, FBs and WFs (p<0.005). On MD-3, CBs revealed significantly higher intensity scores when compared to CFs and CMs, and WFs with higher intensity scores for CFs. Furthermore, FBs had higher volume session scores than CBs, CFs and CMs on MD (p<0.005). Indications reported in this investigation are novel and vitally important when trying to understand positional TLs in relation to match loads among elite soccer players as well as ensure correct preparation of competitive demands. To conclude, the specific multi-modal approach used allows practitioners to combine key positional mechanical volume and intensity metrics as part of a player positional monitoring strategy and ensure a greater focus on targeted physical stressors. As a result, this may improve the training specificity of positional training workloads in direct relation to match-play, subsequently leading to a greater link between increased performance and reduced injury risks.
Keywords: Soccer; GPS Analysis; Tapering; Periodisation; Positional Training Load
Introduction
Team sport success depends upon numerous variants such as player skill, fitness, squad size, tactics and psychological factors, as a result, investigations continue to show an ever-growing appreciation and progression for the use of tools to quantify and monitor training loads (TL) of professional soccer players [1,2]. At the elite level the use of global positioning systems (GPS) to report daily TL placed upon on the individual and collective team is becoming more commonplace [2,3]. Although it is widely accepted that the use of GPS can provide a more detailed summary of the TL (Intensity x Duration) [4] GPS literature has generally provided isolated metric outcomes such as total distance covered (TDC), high-speed running (HSR), sprint, acceleration and deceleration activities [1,2,5].
Assessment of the daily training load (TL) in professional soccer is well reported, however, within the soccer specific literature TL metrics are reported in isolation and without link to competition [3]. Accordingly, Jaspers et al. [6] state that despite the availability of more detailed TL indicators, the utility of these variables in relation to training outcomes is rare. Currently within soccer team training is usually completed collectively without a position specific orientation, this is despite each individual responding differently to similar TL [7,8]. Furthermore, reporting collective data to improve knowledge and enhance efficiency is vital, however, understanding the positional and individual differences within the sport in terms of specific movement demands imposed upon elite professional soccer players in training and match play is of paramount importance [1]. Although important with its role in developing preparedness for competitive match play, research surrounding the positional training outputs linked to match demands is currently very limited.
The link between training and competition from a periodisation perspective has gained more interest over recent years [9] however, further reporting TL with a direct link to performance preparation is underreported. Tapering training approaches to elite level soccer may facilitate longitudinal progressive adaptations and concurrently reduce injury risk [10,11]. Reporting this information as a multimodal approach in line with positional roles in direct relationship with competition demands could potentially provide a more effective monitoring approach when developing or planning training content. Like many team sports, soccer has a degree of positional variation with regard to training and matchplay demands. Indeed, central midfield (CM) players and full backs (FB) have been shown to cover significantly greater distances than central defensive players in both training and competitive match studies [9,12-14]. Literature suggested that this is may be attributed to these positions tactical roles during match play, resulting in reductions in wellness [2] and increase muscular damage [2] and decrements in neuromuscular qualities [2] meaning that managing the training elements of all positions and ensuring appropriate recovery in order to ensure positive competitive performance is of paramount importance to coaches and practitioners. Barnes et al. [13] observed that across a seven-season period, high-intensity running distance and high-intensity actions increased by ~30% (890±299 vs. 1,151±337m, p<0.001; ES: 0.82) and ~50% (118±36 vs. 176±46, p<0.001; ES: 1.41), respectively. Furthermore, Central midfielders have consistently been found to cover the greatest total distance whilst full backs, central midfielders and wide midfielders run greater distances at high intensities [14,15,16]. Various reasons have been proposed as to why these positional differences in locomotive patterns exist. Research demonstrates that positional differences in maximal oxygen uptake (VO2max) are evident for soccer players, with central midfielders and full backs displaying the highest values [17] whist others found no differences [18]. Nevertheless, central midfielders and full backs consistently have the greatest physical capacities when assessed using intermittent running tests [17,19]. In a report of TL positional differences across a microcycle [9] reported positional differences across TL variables with respect to days preceding competitive match play. Furthermore, it was revealed that CD recorded lower total distances covered (TDC) when compared to CM and WF concurring with previous literature in this area. Interestingly, CF and WF player’s work-rate is generally characterized by intermittent bursts of HI activity, usually into space to receive a pass form a supporting player or sprinting onto a penetrating pass between the opponent’s defence [9]. However, this may also be based on their tactical roles to press the opposition and win back possession leading to greater TDC and HI distance. Given that much of soccer specific training performed collectively as a team, although substantial positional differences exist, it is crucial that an individualised, positional specific approach is adopted, reported and understood within a training context. Being able to provide clarification of the TL across a microcycle may lead to a more comprehensive understanding of positional tapering approaches in elite soccer to ensure positive performances during match-play. Therefore, the primary aim of the current investigation was to examine the position specific intricacies of a novel, contemporary and clear positional multi-metric method examining a tapering structure in-season.
Methods
Participants
Twenty-nine (n=29) senior male European professional soccer players (26.7±4.07yrs, 183.4±5.87cm, 78.4±8.03kg, 57.55±5.32mL·kg-1·min−1 and 54.12±13.65mm) were assessed throughout the investigation. Five of the players involved within this investigation were members of their respective national team. Players were grouped into positional units for assessment throughout the investigation: Full Backs (FB) (n=6), Central Defenders (CD) (n=6), Central Midfielders (CM) (n=5), Wide Forwards (WF) (n=8) and Central Forwards (CF) (n=4). Informed consent and medical declaration were obtained from participants in line with the procedures set by the local institutions research ethics committee. The study was fully approved by the involved Sports Science and Medical Department at the Football Club.
Procedures, content and study design
The study was conducted over a 22-week mesocycle period during the mid-phase of the competitive season. This mid-season phase was used for the assessment as to ensure minimal fitness changes and subsequent metric changes per training sessions. Daily analysis from training weeks situated within a 1-game week were used within the study to track the positional demands across a regular tapered micro-cycle. 2-game weeks were not assessed in this study due to the TL being significantly different when compared with 1-game training weeks [20]. Players included within the data collection were selected based on their positions within the team but were inclusive of both starting and non-starting players. During the investigation period, all players were instructed to maintain normal daily food and water intake. No additional dietary interventions were undertaken throughout the investigation
Training assessment
Throughout the investigation, data from 88 training sessions used for analysis. The data assessed included 22x1-week blocks of full training sessions per player, per position: 22xmatch day-4 (MD-4) which describes the training session 4 days preceding the match, 22xmatch day -3 (MD-3), 22 x match day-2 (MD-2), and 22xmatch day-1 (MD-1). No other data pre-MD-4 was considered for analysis as they did not have any specific on pitch content of adequate TLs. All training sessions within the investigation peri od were played on an outdoor grass training field with an average temperature of 12.7±2.4 °C. Goalkeeper’s data were excluded from the study and the data analysis. All players were fully familiarized with the type of training sessions and use of GPS. Training sessions were preceded by a standardized warm-up period of 15min and player data were assessed and compared with respect to their individual playing position post training sessions. The microcycles selected for assessment due to these microcyles including full-training weeks following a 1-game period in order to minimize the potential for accumulative fatigue build-up causing variations across specific metrics.
Player running analysis (GPS data)
Each individual player’s running profile each match and training session were analysed using a 10-Hz GPS device (S4, Catapult Innovations, Melbourne, Australia). The current system has previously been shown to be a valid and reliable for the assessment of intermittent movement profiles [21]. For the purpose of the study, the 4 key variables recorded throughout the sessions included TDC, HSR (19.8-25.2 km.h−1), sprint distance (SPD: >25.2km.h−1) and the sum of high intensity efforts which is described as the total number of high accelerations and decelerations (Sum A: D >4m.s-2). All variables recorded for assessment were reported in both absolute and relative terms. For the purpose of this study, the specific speed thresholds set were in line with previous research [9] and the average values per player taken from the com complete training sessions were used for analysis in relation with their maximum competitive match play data. Maximum match day data was used as the benchmark for the microcycle analysis in order to represent the data as a percentage of the player maximal capacity and physical potential. The average values per player, per position were taken from the complete training sessions and used for analysis.
Load management analysis (GPS data)
With the aim of attaining a global daily and weekly volume+intensity score for each playing position, a contemporary load management analysis technique as used by Owen et al. [9] incorporating 4 volume based (TDC; HSR; Sprint Dis; Sum of HIE) and 4 intensity (TDC. min; HSR. min; Sprint Dis. min; Sum of HIE. min) GPS metrics. In order to attain the daily volume and intensity scores, average individual player data was pooled (i.e. as shown in the below calculation) to provide a squad average to create an initial session metric outcome score (Table 1). The mean individual data assessed was then compared to the average maximum individual competitive match play metric achieved and reported as a percentage figure in positional units. The individual percentage volume and intensity of the session were generated through the following calculation:


statistical analysis
All variables are reported as mean±SD unless stated. Prior to analysis all variables were assessed for normality with the Shapiro- Wilk test. A 1-way analysis of variance (ANOVA) was used to analyse difference in the GPS metrics between playing positions. Another 1-way ANOVA was used to analyse differences between GPS metrics, for each playing positions. When p was found significant (p<0.05), paired t-test comparisons were used to determine differences between the five playing positions and between the eight metrics. The interaction positions: day was also analysed using a two-way ANOVA and t-test paired comparisons were used to compare the playing positions within the days. Holm’s Bonferroni method for controlling type 1 error [22] was also used, therefore a p<0.005 was considered significant for the ten between-positions comparisons, and a p<0.0017 for the twenty-eight between-metrics comparisons. The effect sizes (ES) were calculated for all paired comparisons and evaluated according to [23] as small: <0.50, moderate: <0.50-0.80, and large: >0.80.
Results
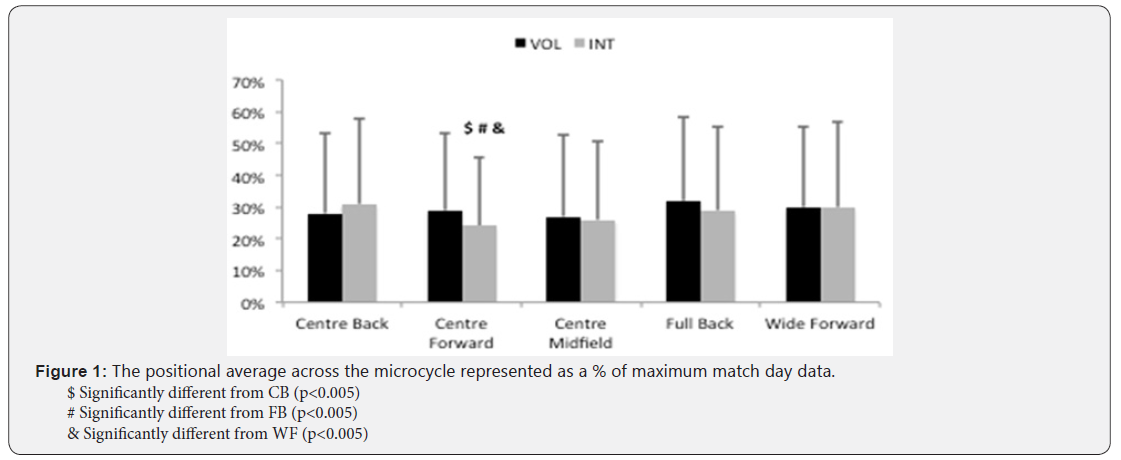
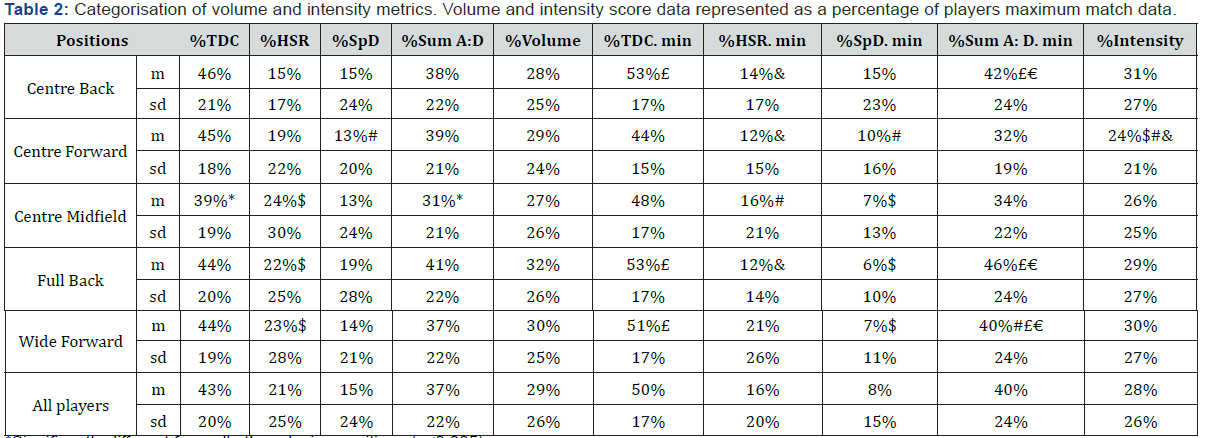
Daily average volume session score was 29±26% and daily average intensity session score was 28±26%, for all players. Over these averages, CF had lower intensity score than CB (ES: 0.28), FB (ES: 0.20) and WF (ES: 0.24) (p<0.005) (Figure 1). Differences were also found amongst playing positions across the different metrics (Figure 2, Table 2). In %TDC and %Sum A:D, CM had lower score than all others (ES: 0.24-0.48); in %HSR, CB had lower scores than CM (ES: 0.39), FB (ES: 0.34) and WF (ES: 0.36); in %SpD, CF had lower score than FB (ES: 0.26); in %TDC. min, CF had lower score than CB (ES: 0.54), FB (ES: 0.52) and WF (ES: 0.42); in %HSR. min, CM had higher score than FB (ES: 0.25), and WF higher than CB (ES: 0.32), CF (ES: 0.44) and FB (ES: 0.44); in %SpD. min, CF had higher score than FB (ES: 0.33), and CB higher score than CM (ES: 0.41), FB (ES: 0.48) and WF (ES: 0.44); and in %Sum A: D. min, CB, FB and WF had higher score than CF (ES: 0.36-0.61) and CM (ES: 0.25-0.48), and WF higher score than FB (ES: 0.24) (p<0.005).
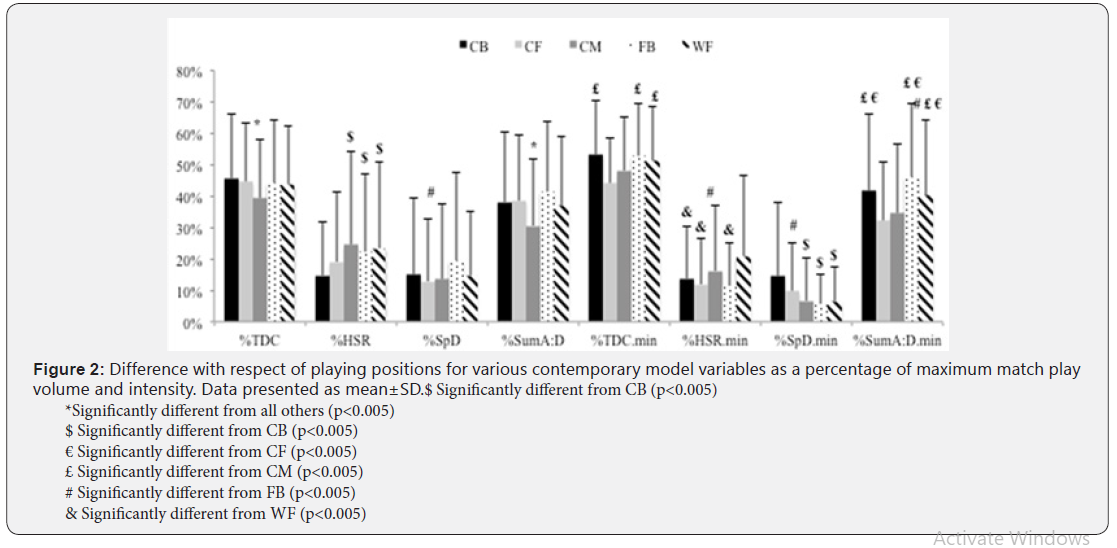
*Significantly different from all other playing positions (p<0.005) $Significantly different from CB (p<0.005) £ Significantly different from CM (p<0.005) # Significantly different from FB (p<0.005) &Significantly different from WF (p<0.005)
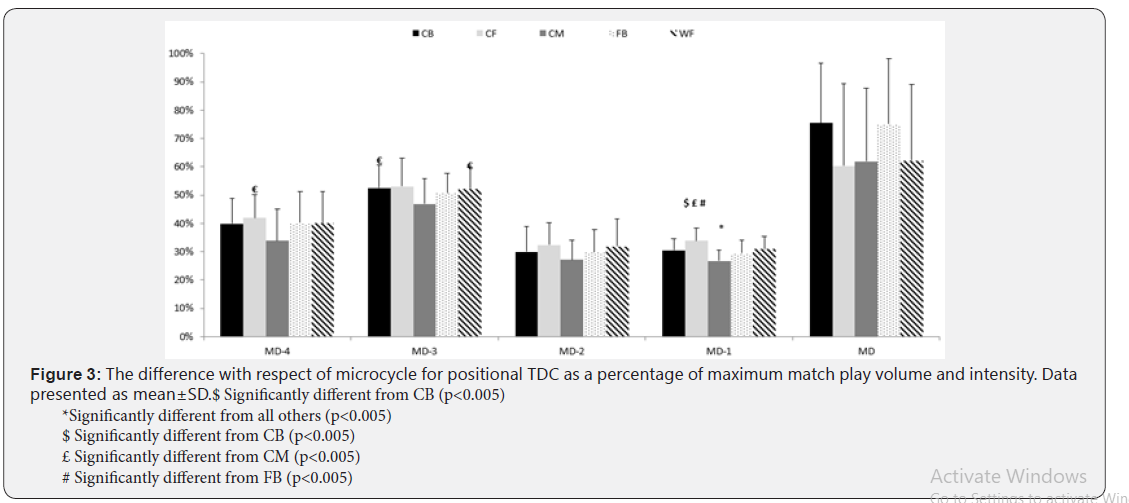
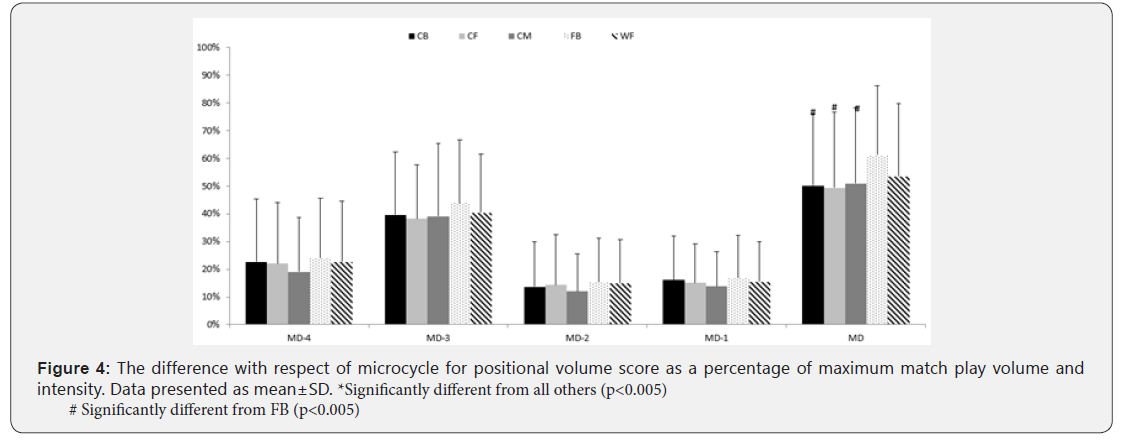
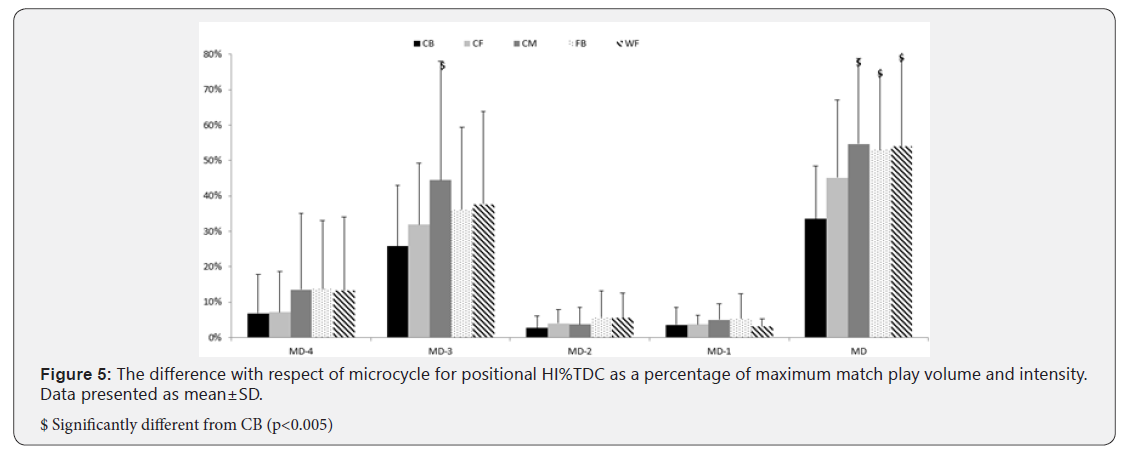
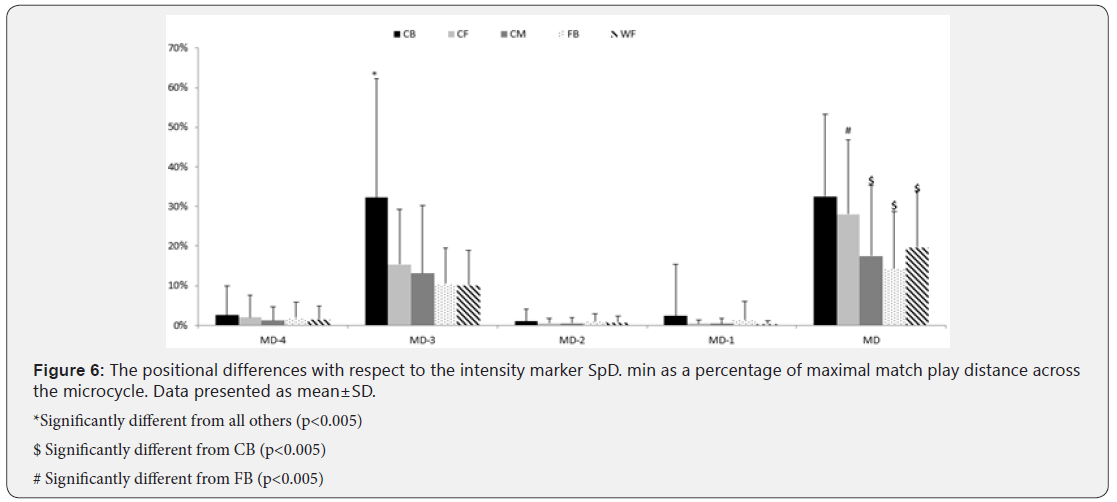
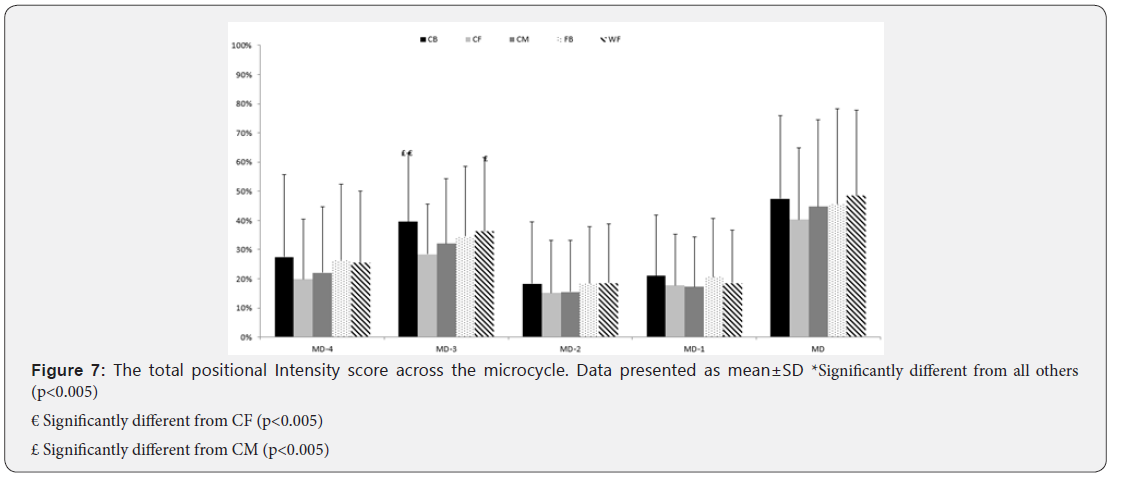
Over the day-to-day perspective, FB had higher volume session score than CB (ES: 0.42), CF (ES: 0.45) and CM (ES: 0.38) in MD, CB had higher intensity session score than CF (ES: 0.54) and CM (ES: 0.35) in MD-3, and WF had higher score than CF (ES: 0.34) in MD-3 (p<0.005) (Figure 3). In the interaction positions: days, no significant results were observed in %SpD, %Sum A:D, %TDC. min, and %Sum A:D.min metrics. Differences in %TDC, %HSR, %HSR. min and %SpD. min is presented in (Figures 3-7) respectively. The differences across GPS metrics according to the playing positions are presented in Table 2. Across averages, and in all playing positions, %TDC. min > %TDC with no difference for CF. Across all positions similar scores for %Sum A: D. min were recorded except for CF (ES: 0.33-0.44) who were observed to have increased %Sum A:D. Lower %SpD. min were (p<0.0017) observed for all positions except CB (ES: 0.23-0.34). Additionally, the %HSR was similar across all positions except for the higher observed values for CM (ES: 0.22) and WF (ES: 0.29). Finally, similar %SpD were observed for al positions except CM (ES: 0.32) and WF (ES: 0.34).
Discussion
The primary aim of the current investigation was to examine a novel, contemporary and clear multi-metric method to better examine the positional tapering strategies of an elite European soccer during an in-season period. The main finding of the current investigation was the identification of a link between playing position and match running performance in elite soccer players which is in-line with previous research [24,25]. It is pretty well-established that wide midfielders cover more total and high-intensity running than central defenders [26-29] and that HI running, and average HI distances increase during the most intense period of matches, with this increase dependent on positional roles and tactical responsibilities within the game [30]. Our findings suggest that significant positional differences exist for TL variables with respect to days preceding competitive match play (i.e different positional tapering strategy).
The current data show large differences in CM players and all other positions within training environments when comparing TDC as a percentage of MD data. These data highlight that midfielders TDC training response is significantly lower when compared to other positions of play. These findings maybe as a result of the increased TDC within game play for midfielders when compared to other positions. Indeed, previously CM have consistently been found to cover the greatest total distance during game play [14-16,28]. Furthermore, these positions have been shown to have increased CK and reduced CMJ during the training week due to increased workload during game play [9]. Overall these results have practical significance for coaches suggesting that when using TDC and as a percentage of MD data as a TL variable of interest coaches will be able to identify if specific positions are appropriately loaded prior to match play. For example, within the current investigation there appears to be a specific underloading of CM when compared with other positions of play.
Consistent with the above findings for TDC as a percentage of match plat we show that large difference exists between the loading prescribed for CM when contrast against all other positions within training when analysis %sum A:D as a percentage of MD data. The current findings highlight how the assessed metric (%sum A:D) training response is significantly lower for midfielders when contrast all other positions. The above findings can be related to the increased TDC in game play for MD players when compared to all other positions [29]. Indeed, these MD players have tactical duties both in attack and defence acting as link players in attack while also providing additional cover for defensive players in defence. These tactical roles may result in greater changes of directions influencing the A:D observed [13].
From the data resented we observed that when assessing the total positional average across the microcycle as a percentage of maximum match day data, CF covered significantly less average intensity scores when compared with CB, FB, and WF players. These findings suggest that following this type of microcycle training structure CF, may require an additional training stimulus such as top up conditioning through small-sided games of high intensity shuttle running, to increase both the intensity and volume markers of these positions in terms of maximum match day output [31,32]. However, this should be completed in accordance with assessments to ensure performance preparation is not hampered and injury risk is increased [9]. When the volume-based metrics were considered we observed that CB and CF positions were significantly underloaded with regard to HSR in training when assessed as a percentage of MD data. These findings are of great importance to coaches as these positions are directly associated with more explosive actions that directly affect the game through creating or preventing scoring opportunities [5,9,16]. As a result of these findings, ensuring these positional demands are induced with sufficient HSR exposures within the training content is vitally important not only for performance preparation, but from an injury risk perspective. Previously Malone et al. [9] revealed that team sports players exposed to sufficient maximal velocity bouts reported significantly reduced injury risks compared to those players who were under or overloaded with the same stimulus. When positional volume comparisons of SpD across the microcycles were analysed, we observed that CF performed significantly less volumes when compared with FB but not any other positions. Again, these findings may suggest that CF who are generally involved in high explosive actions, may require extra SpD volume stimulus, or adversely, the FB require a reduced amount of SpD volume across the microcycle. Understanding the performance profiles, injury rates and tactical efficiency of the players will however, determine whether or not this is correct in terms of load management, with soccer players have been shown tolerate increased SpD during training with increased intermittent aerobic capacities [9]. Our data reveals that when TDC ·min is considered by coaches as a TL volume measure that CB, FB and WF perform increased volume when compared with CM players with respect to percentage of match day values. This can be related to the increased intensity of training with respect to these positions when compared to competitive games. The fact the CM positional role induces a greater TDC based on the role employed, can be related to the consistent higher running performance requirements of these positions. Recent literature has highlighted CM covering greater TDC in games and training and higher intensity of play reported in m·min-1. However, to date no current literature have reported the data as a percentage of match day data. The main practical application of these observations is that CM perform significantly less intensity in training when directly related to match data and compared across positions. This could potential mean that these positions require additional conditioning top-ups during specific periods of the season [9].
One of the most interesting findings from reported data using this contemporary positional method of analysis is the fact that CBs, although largely described in the literature as performing less HSR, sprint distance and TDC within games when compared across positional roles [29] within the current investigation CBs performed significantly greater SpD·min-1 values as a percentage of match performance within training environments. This is interesting as it again highlights that the microcycle training pattern used in this study induced a higher sprint demand for CBs in proportion with other positions assessed. The current observation was consistent with MD-3 findings where CBs were shown to have a higher total intensity scores than CFs and CMs respectively. These findings may highlight an overload with regard to total intensity for CBs on MD-3 within the current investigation. These observations show the practical nature of the current contemporary approach to monitoring training load by revealing the specific positional training load demands of players relative to match play intensities. The findings therefore could potentially allow coaches to better adapt training load in the following days for both the position and the individual. Furthermore, on MD-1, CF covered slightly but significantly higher %TDC than CBs, CMs and FBs (p<0.005) and CMs lower %TDC than all others (p<0.005). CFs and CMs were also largely described in the literature as the playing positions covering the least and the most distance, respectively. Therefore, the high and low proportion of TDC observed for these playing positions, respectively, was not an alarming indication and should not be interpreted as a training overload, even though these values were recorded only 24hr prior to competition. The current investigation should be considered with a number of limitations, firstly, it was not possible to collect information relating to the lower limb non-contact injury occurrence across the period. Future research should aim to assess the impact of the application of the current contemporary model with regard to the injury-workload relationship. Given that objective measures of internal load have been related to fitness increments in team sports athletes, future research should aim to apply the current model to internal measures of load and assess their association with changes in fitness changes across a training period.
Practical Application
The current study proposed a position specific contemporary multimodal method to represent a player specific tapering and periodisation strategy for both volume and intensity markers across an in-season period amongst professional European soccer players. We have shown that significant differences exist between TLs (i.e., volume and intensity) across both positions and microcycles assessed when representing TL as a percentage of match play, resulting in both overloading and underloading in relation to MD values for specific positions. Using this specific multi-modal approach may allow practitioners to combine key mechanical volume and intensity metrics assessed as part of their athlete or player monitoring strategies to vary the physical stressors depending upon the specific tapering or periodisation approach followed for a given microcyle period. To conclude, this monitoring strategy brings together the key reported metrics from a mechanical perspective revealing a positive portrayal of a periodisation or tapering strategy in order to identify differences between intensity and volume markers across the positional lines of play within an elite European soccer team. The present study demonstrates that the use and integration of a multimodal approach to monitoring TL in direct relationship with competitive soccer match-play at the elite level provides a better weekly review of both player intensity and volume markers for specific positions and can be utilised by coaches to understand the overloading or underloading of specific positions during a microcycle. The current model could be further enhanced by understanding the day-to-day player variance, fitness and wellness state in accordance to the coaching demand corresponding to match-day activity. Continual TL monitoring across the pre- and in-season phases should be performed to prevent players from overreaching and overtraining. Coaches and physical conditioning staff may also further use this method in order to understand which important key metrics need to be stressed or developed to better prepare individual players for match play demands, additionally the model may provide coaches with a better approach to topping up substitute based players who do not complete match day volume or intensity with regard to running performance measures.
Acknowledgement
This manuscript is original and not previously published, nor is it being considered elsewhere until a decision is made as to its acceptability by the Editorial Review Board. There are no funding sources and are no conflicts of interest surrounding this scientific investigation.
For more Open access journals please visit our site: Juniper Publishers
For more articles please click on Journal of Complementary Medicine & Alternative Healthcare
For more Open access journals please visit our site: Juniper Publishers
For more articles please click on Journal of Complementary Medicine & Alternative Healthcare


Comments
Post a Comment